Correctly Interpreting Accuracy Values for Pressure Sensors

By STS/PMC June 30, 2020
In the search for a suitable pressure transmitter, various factors will play a role. While some applications require a particularly broad pressure range or an extended thermal stability, to others accuracy is decisive. The term “accuracy”, however, is defined by no standards. We provide you with an overview of the various values.
Although ‘accuracy’ is not a defined norm, it can nevertheless be verified from values relevant to accuracy, since these are defined across all standards. How these accuracy-relevant values are specified in the datasheets of various manufacturers, however, remains entirely up to them. For users, this complicates the comparison between different manufacturers. It thus comes down to how the accuracy is presented in the datasheets and interpreting this data correctly. A 0.5% error, after all, can be equally as precise as 0.1% – it’s only a question of the method adopted for determining that accuracy.
Accuracy values for pressure transmitters: An overview
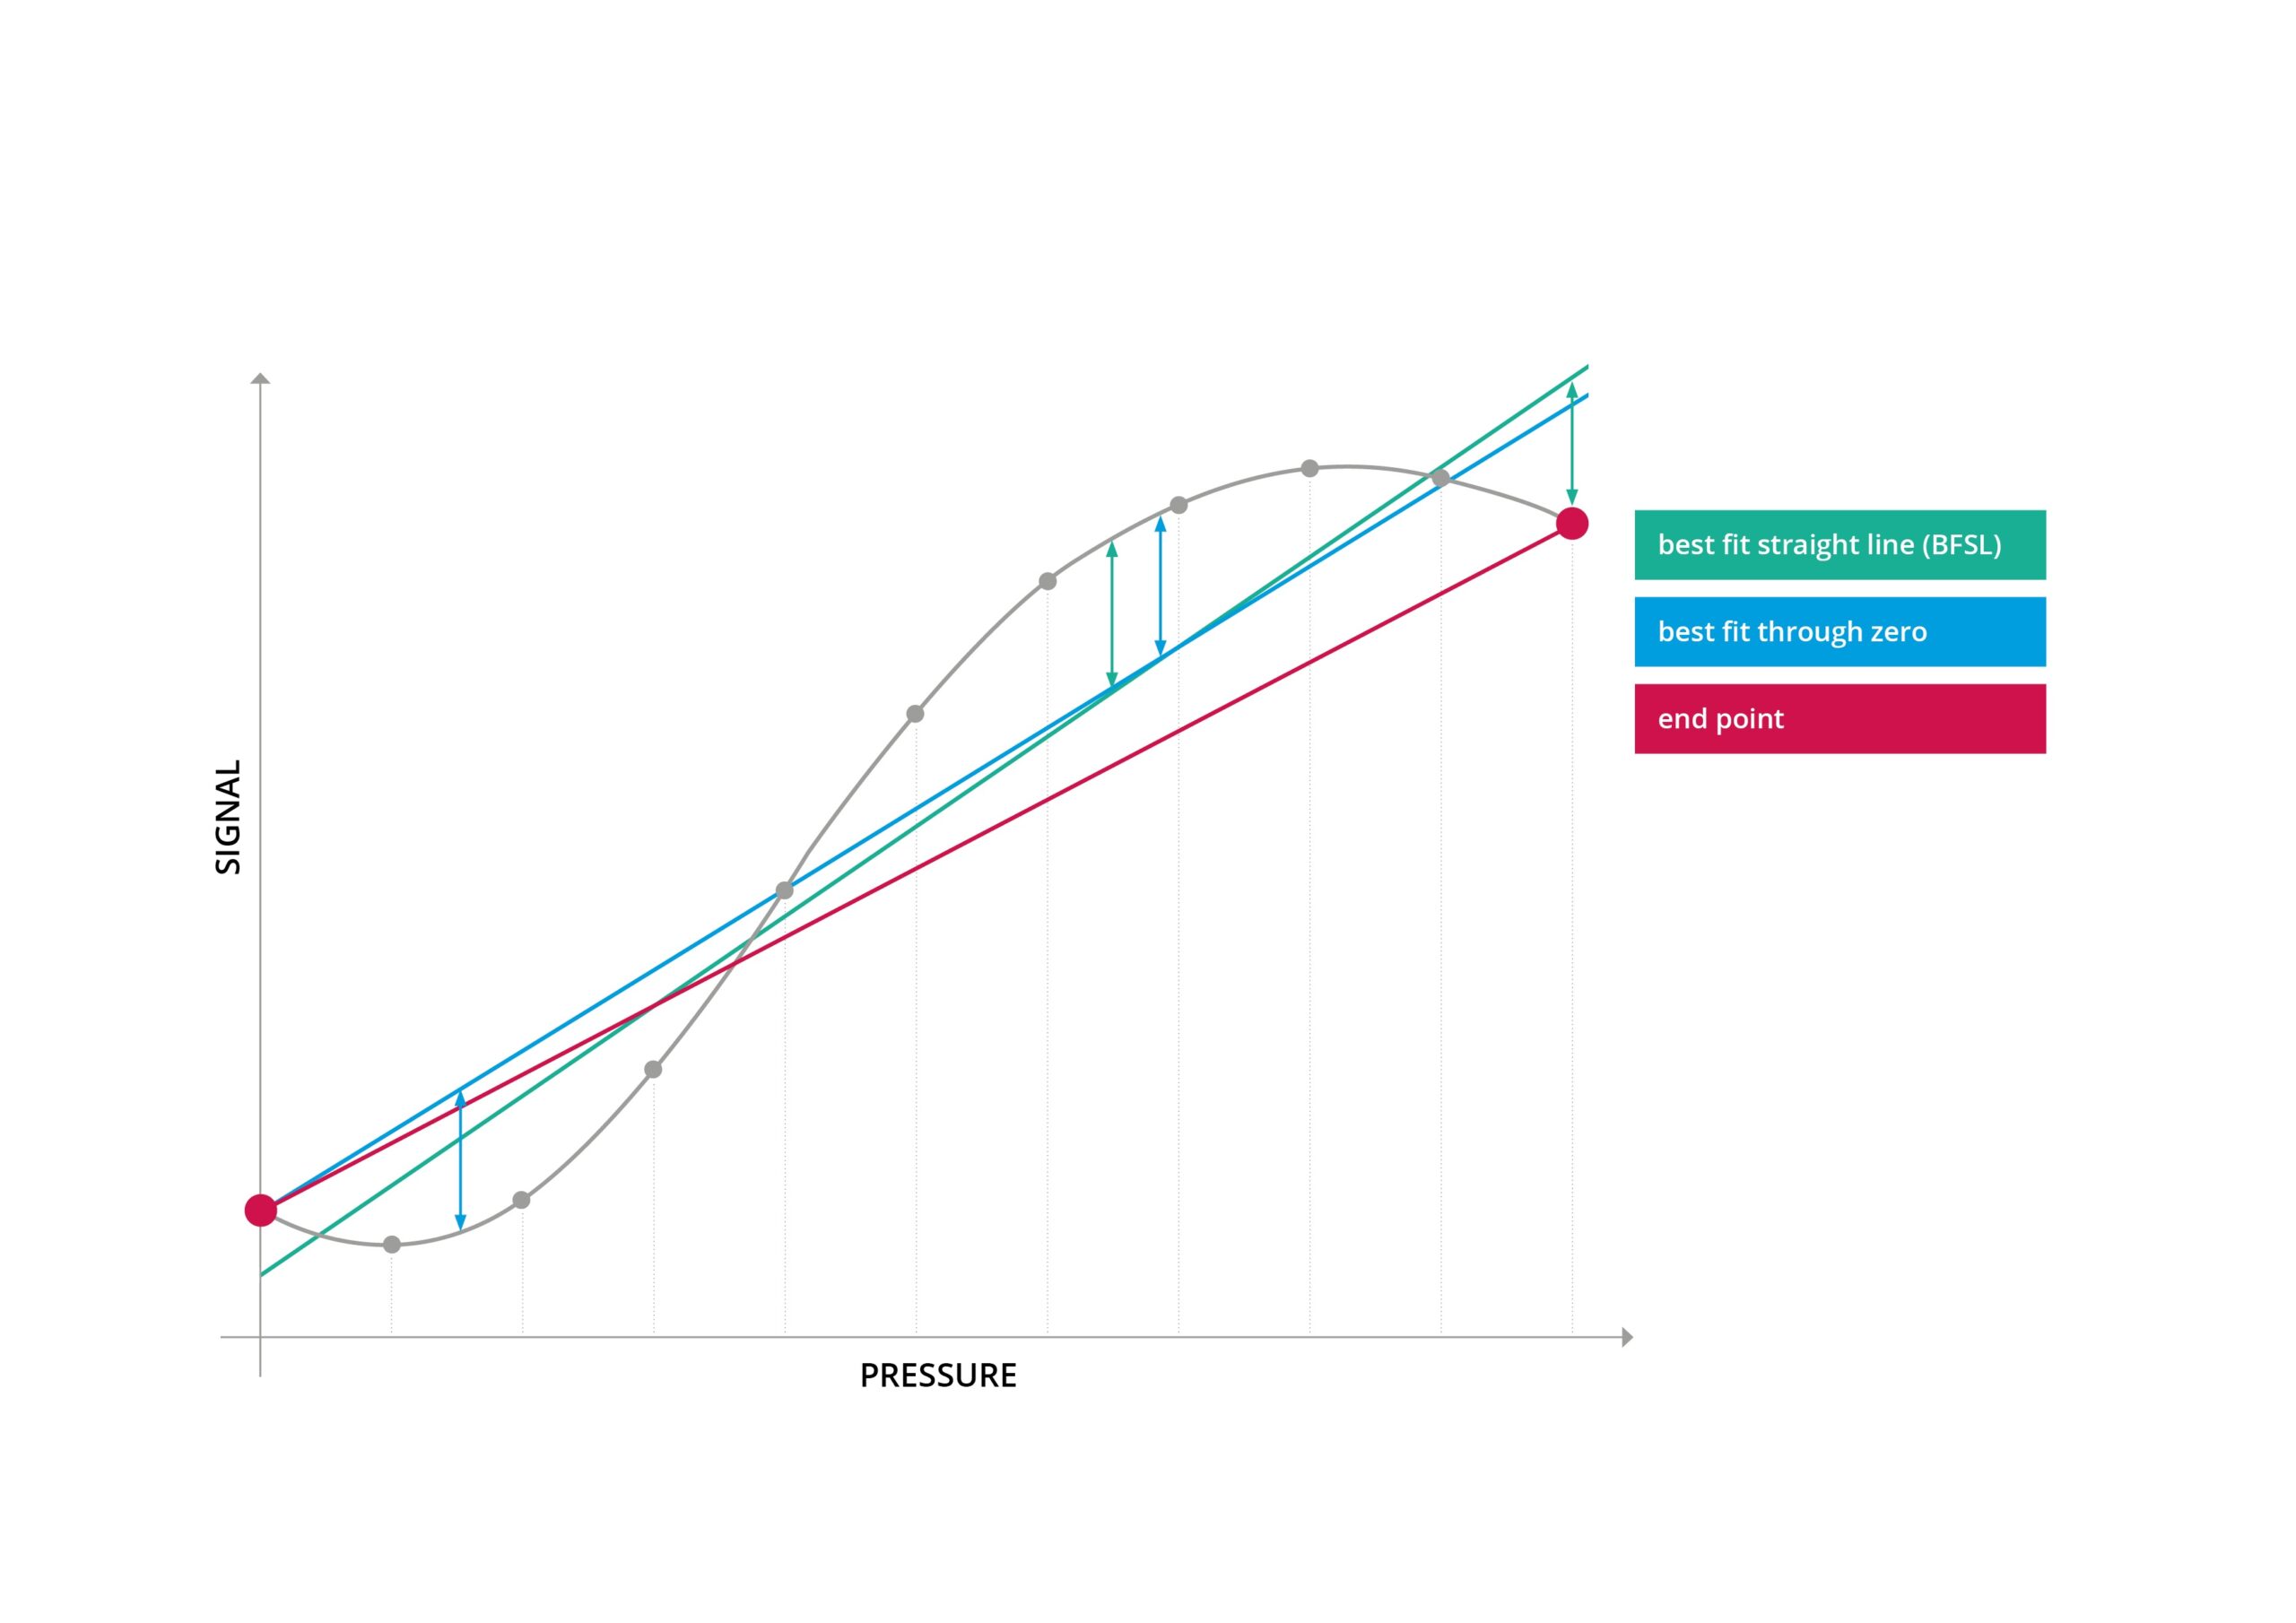
The most widely applied accuracy value is non-linearity. This depicts the greatest possible deviation of the characteristic curve from a given reference line. To determine the latter, three methods are available: End Point adjustment, Best Fit Straight Line (BFSL) and Best Fit Through Zero. All of these methods lead to differing results.
The easiest method to understand is End Point adjustment. In this case, the reference line passes through the initial and end point of the characteristic curve. BSFL adjustment, on the other hand, is the method that results in the smallest error values. Here the reference line is positioned so that the maximum positive and negative deviations are equal in degree.
The Best Fit Through Zero method, in terms of results, is situated between the other two methods. Which of these methods manufacturers apply must usually be queried directly, since this information is often not noted in the datasheets. At PMC/STS, the characteristic curve according to Best Fit Through Zero adjustment is usually adopted.
The three methods in comparison:

Measurement error is the easiest value for users to understand regarding accuracy of a sensor, since it can be read directly from the characteristic curve and also contains the relevant error factors at room temperature (non-linearity, hysteresis, non-repeatability etc.). Measurement error describes the biggest deviation between the actual characteristic curve and the ideal straight line. Since measurement error returns a larger value than non-linearity, it is not often specified by manufacturers in datasheets.
Another accuracy value also applied is typical accuracy. Since individual measuring devices are not identical to one another, manufacturers state a maximum value, which will not be exceeded. The underlying “typical accuracy” will therefore not be achieved by all devices. It can be assumed, however, that the distribution of these devices corresponds to 1 sigma of the Gaussian distribution (meaning around two thirds). This also implies that one batch of the sensors is more precise than stated and another batch is less precise (although a particular maximum value will not be exceeded).
As paradoxical as it may sound, accuracy values can actually vary in accuracy. In practice, this means that a pressure sensor with 0.5% error in maximal non-linearity according to End Point adjustment is exactly as accurate as a sensor with 0.1% error of typical non-linearity according to BSFL adjustment.
Temperature error
The accuracy values of non-linearity, typical accuracy and measurement error refer to the behavior of the pressure sensor at a reference temperature, which is usually 75°F. Of course, there are also applications where very low or very high temperatures can occur. Because thermal conditions influence the precision of the sensor, the temperature error must additionally be included. More about the thermal characteristics of piezoresistive pressure sensors can be found here.
Accuracy over time: Long-term stability
The entries for accuracy in the product datasheets provide information about the instrument at the end of its production process. From this moment on, the accuracy of the device can alter. This is completely normal. The alterations over the course of the sensor’s lifetime are usually specified as long-term stability. Here also, the data refers to laboratory or reference conditions. This means that, even in extensive tests under laboratory conditions, the stated long-term stability cannot be quantified precisely for the true operating conditions. A number of factors need to be considered: Thermal conditions, vibrations or the actual pressures to be endured influence accuracy over the product’s lifetime.
This is why we recommend testing pressure sensors once a year for compliance to their specifications. It is essential to check variations in the device in terms of accuracy. To this end, it is normally sufficient to check the zero point for changes while in an unpressurized state. Should this be greater than the manufacturer’s specifications, the unit is likely to be defective.
The accuracy of a pressure sensor can be influenced by a variety of factors. It is therefore wholly advised to consult the manufacturers beforehand: Under which conditions is the pressure transmitter to be used? What possible sources of error could occur? How can the instrument be best integrated into the application? How was the accuracy specified in the datasheet calculated? In this way, you can ultimately ensure that you as a user receive the pressure transmitter that optimally meets your requirements in terms of accuracy.
